
Quick Takes
- Risk Assets Push Higher. As the summer reaches its peak, so too are risk assets nearing a climax. The market rallied for the month, but Large Cap equities were dethroned for July as Small Caps made a stellar run for the month. Most major asset classes were positive for July.
- Disinflation Continues. Inflation, as measured by the CPI, showed promising signs of easing. The metric came in below expectations of +3.1% on the year-over-year calculation, landing at 3.0%. The Fed’s preferred metric of PCE, landed in-line with expectations of +2.5% on the year-over-year metric.
- Dollar Declines. As inflation pressures continued to show signs of easing, markets began to more aggressively price in a potential cut in interest rates, which led to the dollar declining against other major currencies for the month of July.
- Personal Spending and Labor Markets. Labor Markets showed signs of weakness with the Unemployment Rate bumping up to +4.1% in the July reading. With Labor Markets softening, it’s of little surprise that Personal Income landed below market expectations while Personal Spending came in-line with survey estimates for the month of July
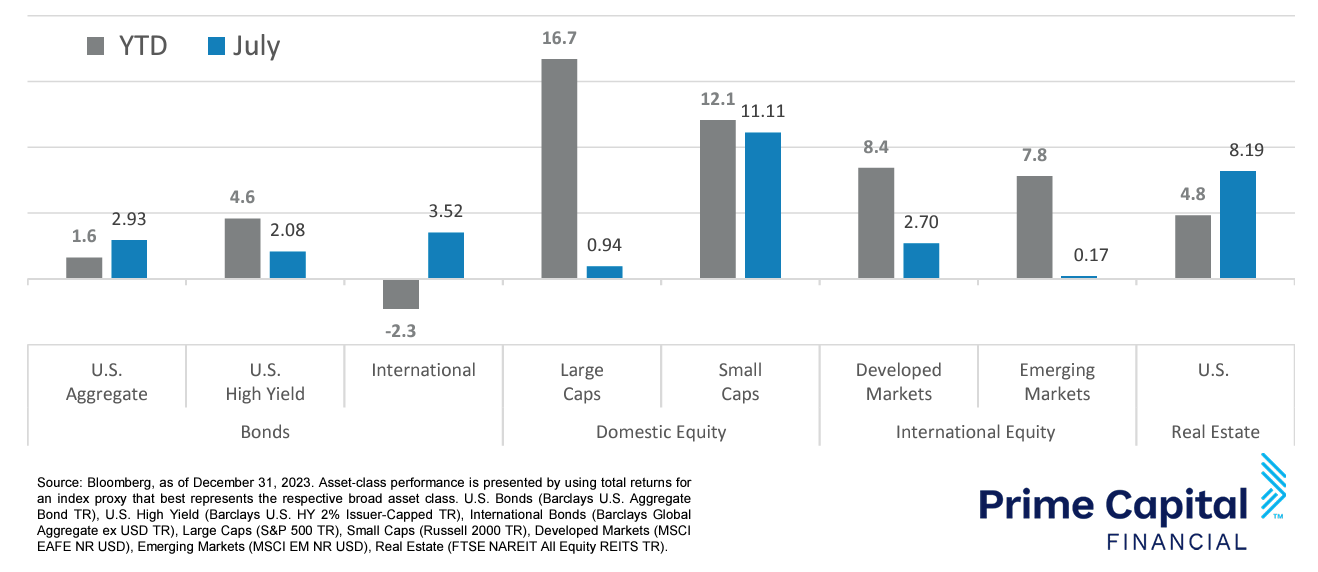
Asset Class Performance
Large Caps lost some momentum in the month of July, dethroned by Small Caps, as markets began rotating beyond the Magnificent 7, but were still slightly positive for the month. Most major asset classes were in the green for July and the Year-To-Date figure, the exception being International Bonds as they have struggled against the rising dollar.
Markets & Macroeconomics
While the weather in the month of July continued to heat up, Labor Markets showed signs of cooling off. The number of Job Openings fell to 8.18 million, down slightly from the previous month’s figure of 8.34 million. While this was still above most survey estimates, the decline in openings lowered the ratio of Job Openings to Unemployed Workers to 1.2. With Labor Markets nearing a balance between available positions and laborers, the upward pressure on Wage Growth should continue to show signs of softening. The downstream effects of this should impact Consumer Spending and ultimately work its way into Inflation metrics. All of the aforementioned data points have showed signs of consistently cooling over the summer months. With the softening of economic data points, the case for the Fed to begin their easing of monetary policy gains momentum. With Consumers already being strapped with the recent impact of higher inflation and now losing the momentum of increasing Wage Growth, it’s very likely that we will see the Consumer continue to cutback their spending to ease the pressure on their wallets. While ultimately good for Disinflation to continue, Consumer Spending has been the champion of the US economy recently, almost single handedly keeping GDP growth in positive territory. Now with the Consumer likely to exit stage left, market participants are beginning to show signs of concern that the Fed has held monetary policy too tight for too long. Markets steadily increased their probability of rate cuts coming sooner rather than later, with some rumors even beginning to circulate that the Fed might convene an emergency meeting to cut rates before their regularly scheduled meeting in September.
Bottom Line: With Inflation continuing down the softening pathway, a multitude of other data points also cooled off in the peak of Summer. Labor Markets were one of the softening data points with the ratio of Job Openings to Unemployed Workers falling to 1.2, nearing a balance in the jobs market. With Unemployment ticking up, this decreased pressure on Wage Growth, which ultimately meant that Consumers had less excess cash to spend in the summer months. The positive downstream effect is that this should continue to relieve upward price pressure and bodes well for continued Disinflation. The negative side of this data reading is that the Consumer has propped up the US economy, keeping growth modestly positive. Many market participants are becoming concerned that the Fed has tightened monetary policy too much for too long and have more aggressively begun pricing in interest rate cuts sooner rather than later.
Download the full review.
©2024 Prime Capital Investment Advisors, LLC. The views and information contained herein are (1) for informational purposes only, (2) are not to be taken as a recommendation to buy or sell any investment, and (3) should not be construed or acted upon as individualized investment advice. The information contained herein was obtained from sources we believe to be reliable but is not guaranteed as to its accuracy or completeness. Investing involves risk. Investors should be prepared to bear loss, including total loss of principal. Diversification does not guarantee investment returns and does not eliminate the risk of loss. Past performance is no guarantee of comparable future results.
Source: Sources for this market commentary derived from Bloomberg. Asset‐class performance is presented by using market returns from an exchange‐traded fund (ETF) proxy that best represents its respective broad asset class. Returns shown are net of fund fees for and do not necessarily represent performance of specific mutual funds and/or exchange-traded funds recommended by the Prime Capital Investment Advisors. The performance of those funds June be substantially different than the performance of the broad asset classes and to proxy ETFs represented here. U.S. Bonds (iShares Core U.S. Aggregate Bond ETF); High‐Yield Bond (iShares iBoxx $ High Yield Corporate Bond ETF); Intl Bonds (SPDR® Bloomberg Barclays International Corporate Bond ETF); Large Growth (iShares Russell 1000 Growth ETF); Large Value (iShares Russell 1000 Value ETF); Mid Growth (iShares Russell Mid-Cap Growth ETF); Mid Value (iShares Russell Mid-Cap Value ETF); Small Growth (iShares Russell 2000 Growth ETF); Small Value (iShares Russell 2000 Value ETF); Intl Equity (iShares MSCI EAFE ETF); Emg Markets (iShares MSCI Emerging Markets ETF); and Real Estate (iShares U.S. Real Estate ETF). The return displayed as “Allocation” is a weighted average of the ETF proxies shown as represented by: 30% U.S. Bonds, 5% International Bonds, 5% High Yield Bonds, 10% Large Growth, 10% Large Value, 4% Mid Growth, 4% Mid Value, 2% Small Growth, 2% Small Value, 18% International Stock, 7% Emerging Markets, 3% Real Estate.
Advisory products and services offered by Investment Adviser Representatives through Prime Capital Investment Advisors, LLC (“PCIA”), a federally registered investment adviser. PCIA: 6201 College Blvd., Suite#150, Overland Park, KS 66211. PCIA doing business as Prime Capital Financial | Wealth | Retirement | Wellness.
© 2024 Prime Capital Financial, 6201 College Blvd., Suite #150, Overland Park, KS 66211.
- Month-in-Review: July 2024 - August 8, 2024
- Advisor calls spike as stocks selloff - August 6, 2024
- Special-Needs Children Deserve Benefits. A Trust Protects Them. - August 6, 2024