Week in Review

Week-in-Review: Week ending in 07.02.21

The Bottom Line

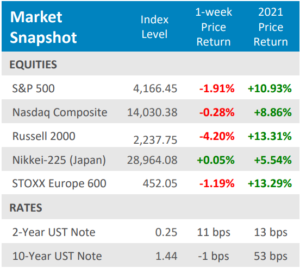
● U.S. equities reached more record highs after seven straight gains, it best winning streak in 10 months. It was the second straight week of gains for the S&P 500, which is now up in five of the last six weeks.
● The yield on the 10‐year U.S. Treasury dropped 10 basis points, closing at 1.42%. Meanwhile, the price of a barrel of West Texas Intermediate crude oil rose above $75, hitting its highest level since 2018.
● Economic data continued to suggest solid expansion, with strong manufacturing and consumer confidence reports, as well as solid June jobs data that come in higher than expected, but with moderate wage gains.

Stocks rebound from last week’s fall

The S&P 500 posted another solid week of gains with seven consecutive winning sessions, its longest winning streak since August. For the week, the S&P 500 climbed +1.7% and the tech‐heavy Nasdaq Composite rose nearly +2%. The S&P 500 has now risen in five of the past six weeks, while the Nasdaq has gained in six of the past seven weeks. One weak spot for equities was small caps, as the Russell 2000 Index fell ‐1.2%for the week. The price of a barrel of West Texas Intermediate crude oil rose above $75, hitting its highest level since 2018. Signs of solid economic growth continued with June U.S. manufacturing activity from both ISM and Markit coming in at historically high levels and well into expansion territory. Several major banks announced plans to return capital to shareholders in the form of increased dividends and share buybacks following last week’s successful stress test of the sector by the Fed. But the market was particularly enthused by a solid employment report for June that was released on Friday. June nonfarm payrolls easily topped economists forecast. Factory orders also topped estimates and consumer confidence hit its highest level since February 2020, before the pandemic.

Digits & Did You Knows

FEWER BABIES — Despite a year of lockdowns with our spouses/partners, the number of US births fell in 2020 to 3.6 million, the 12th decline in the last 13 years (source: CDC).
TRAVEL — When travel for vacations slowed in the summer of 2020, rental car companies sold off more than 500,000 rental cars just to survive, leading to a shortage of rental cars and higher prices in 2021 (source: CNN, BTN Research).
(POOL) HELP WANTED — U.S. cities don’t have enough lifeguards, e.g., Austin, TX is short 80% of its 750‐lifeguard goal for the summer of 2021. The pandemic shutdown put a freeze on training and certification programs for lifeguards (source: American Lifeguard Association, BTN Research).

Click here to see the full review.

Source: Bloomberg. Asset‐class performance is presented by using market returns from an exchange‐traded fund (ETF) proxy that best represents its respective broad asset class. Returns shown are net of fund fees for and do not necessarily represent performance of specific mutual funds and/or exchange‐traded funds recommended by the Prime Capital Investment Advisors. The performance of those funds may be substantially different than the performance of the broad asset classes and to proxy ETFs represented here. U.S. Bonds (iShares Core U.S. Aggregate Bond ETF); High‐YieldBond(iShares iBoxx $ High Yield Corporate Bond ETF); Intl Bonds (SPDR® Bloomberg Barclays International Corporate Bond ETF); Large Growth (iShares Russell 1000 Growth ETF); Large Value (iShares Russell 1000 ValueETF);MidGrowth(iSharesRussell Mid‐CapGrowthETF);MidValue (iSharesRussell Mid‐Cap Value ETF); Small Growth (iShares Russell 2000 Growth ETF); Small Value (iShares Russell 2000 Value ETF); Intl Equity (iShares MSCI EAFE ETF); Emg Markets (iShares MSCI Emerging Markets ETF); and Real Estate (iShares U.S. Real Estate ETF). The return displayed as “Allocation” is a weighted average of the ETF proxies shown as represented by: 30% U.S. Bonds, 5% International Bonds, 5% High Yield Bonds, 10% Large Growth, 10% Large Value, 4% Mid Growth, 4%Mid Value, 2% Small Growth, 2% Small Value, 18% International Stock, 7% Emerging Markets, 3% Real Estate.

Advisory services offered through Prime Capital Investment Advisors, LLC. (“PCIA”), a Registered Investment Adviser. PCIA doing business as Prime Capital Wealth Management (“PCWM”) and Qualified Plan Advisors (“QPA”).

© 2021 Prime Capital Investment Advisors, 6201 College Blvd., 7th Floor, Overland Park, KS 66211.

Week in Review

Week-in-Review: Week ending in 06.25.21

The Bottom Line

● Trading remains choppy but volatility dropped as stocks rallied to new record highs and rebounded nicely from last week’s pullback. Gains were broad based with both U.S. and overseas stocks rising across styles and sectors.
● The yield on the 10‐year U.S. Treasury turned higher this week, following Fed Chair Powell’s dovish Capitol Hill testimony, in contrast to the Fed’s hawkish tone the prior week. As a result, the yield curve returned to steepening.
● Economic data continued to suggest solid expansion with stronger than expected growth in the preliminary June manufacturing and services purchase managers indices which hit a new record high of 62.6.

Stocks rebound from last week’s fall

Stocks posted solid weekly gains and set more fresh record highs along the way. The S&P 500 finished at an all‐time high on Friday, capping its best week since February with a +2.7%advance to rebound from last week’s Federal Reserve‐induced pullback. The giant cap Dow Jones Industrial Average rose +3.4%, the small cap Russell 2000 Index popped +4.3%, and the tech‐heavy Nasdaq Composite climbed +2.4%, after hitting an all‐time high on Thursday. As stocks rallied, Treasuries were choppy after last week’s hawkish monetary policy comments by the Fed, while Fed Chairman Jerome Powell was more dovish this week in his Congressional testimony stating the central bank sees no risk of runaway inflation and will support the economy for as long as it takes to complete its recovery. The yield on the 10‐year note rose +8 basis points (bps) over the week to 1.52%. The Treasury yield curve steepened after last week’s unexpected flattening. On Thursday a group of bipartisan Senators and President Biden agreed on a nearly $1 trillion spending package over five years for core infrastructure projects such as roads, bridges, and mass transit. Economic data continues to suggest solid expansion.

Digits & Did You Knows

STOCKS AND INFLATION — In the last 70 years (1951‐2020), inflation as measured by the Consumer Price Index (CPI) has been at least +5% in 12 different years, most recently in 1990. The total return for the S&P 500 has been split over those 12 high‐inflation years, rising in 6 and falling in 6. The average total return for the S&P 500 over all 12 years is just+3.2% (source: BTN Research).
FEWER CHOICES — There were 1.16 million existing homes for sale in the U.S. as of 4/30/21, up a bit from the 1.03 million for sale as of 2/28/21, which was the lowest level ever reported for data tracked since 1999 (source: National Association of Realtors, BTN Research).

Click here to see the full review.

Source: Bloomberg. Asset‐class performance is presented by using market returns from an exchange‐traded fund (ETF) proxy that best represents its respective broad asset class. Returns shown are net of fund fees for and do not necessarily represent performance of specific mutual funds and/or exchange‐traded funds recommended by the Prime Capital Investment Advisors. The performance of those funds may be substantially different than the performance of the broad asset classes and to proxy ETFs represented here. U.S. Bonds (iShares Core U.S. Aggregate Bond ETF); High‐YieldBond(iShares iBoxx $ High Yield Corporate Bond ETF); Intl Bonds (SPDR® Bloomberg Barclays International Corporate Bond ETF); Large Growth (iShares Russell 1000 Growth ETF); Large Value (iShares Russell 1000 ValueETF);MidGrowth(iSharesRussell Mid‐CapGrowthETF);MidValue (iSharesRussell Mid‐Cap Value ETF); Small Growth (iShares Russell 2000 Growth ETF); Small Value (iShares Russell 2000 Value ETF); Intl Equity (iShares MSCI EAFE ETF); Emg Markets (iShares MSCI Emerging Markets ETF); and Real Estate (iShares U.S. Real Estate ETF). The return displayed as “Allocation” is a weighted average of the ETF proxies shown as represented by: 30% U.S. Bonds, 5% International Bonds, 5% High Yield Bonds, 10% Large Growth, 10% Large Value, 4% Mid Growth, 4%Mid Value, 2% Small Growth, 2% Small Value, 18% International Stock, 7% Emerging Markets, 3% Real Estate.

Advisory services offered through Prime Capital Investment Advisors, LLC. (“PCIA”), a Registered Investment Adviser. PCIA doing business as Prime Capital Wealth Management (“PCWM”) and Qualified Plan Advisors (“QPA”).

© 2021 Prime Capital Investment Advisors, 6201 College Blvd., 7th Floor, Overland Park, KS 66211.

Week in Review

Week-in-Review: Week ending in 06.18.21

The Bottom Line

  • Equities finished another volatile week solidly lower, with the S&P 500 dropping ‐1.9%. After leading large caps for three consecutive weeks, the small cap Russell 2000 fell sharply, losing ‐4.2% for the week.
  • The yield on the 10‐year U.S. Treasury was little changed, down‐1 basis point, but that masked some big swings in the bond market. Following a surprisingly hawkish tone by the Fed, short yields doubled and long yields fell.
  • Homebuilder confidence remains historically high, but it has been dropping lately and now building permits are falling too. Meanwhile May retail sales were softer than expected and unemployment claims unexpectedly rose.

Stocks battered, yield curve flatter
Global equities finished another volatile week solidly lower, as the U.S. Federal Reserve surprised markets by forecasting earlier‐than‐expected rate hikes and indicated it will discuss tapering asset purchases in coming meetings. The Federal Open Market Committee (FOMC) is now forecasting that it will hike rates twice in 2023 after previously predicting no hikes until 2024. Comments from St. Louis Fed President James Bullard—a non‐voting member this year—added to the Fed’s hawkish tenor with his comments Friday morning. The so called “reflation trade”, which favored value stocks and commodities, came under immediate pressure following the FOMC shift. The bond market also saw significant swings this week as the Treasury yield curve flattened noticeably, with the yield on the 2‐year note almost doubling and longer‐term yields, such as the 30‐year bond, falling (the 30‐ year US Treasury yield plunged ‐16 basis points on Thursday alone). The U.S. Dollar Index rallied to levels not seen since April. Economic data didn’t help as May retail sales came in softer than expected, manufacturing growth in New York and Philadelphia slowed, jobless claims snapped a string of weekly declines, and producer inflation ran hot.

Digits & Did You Knows
SLIGHTLY USED — The average age of vehicles on U.S. roads last year was 12.1 years, a record high. The average has been rising steadily for 15 years as car quality has improved, but the pandemic accelerated the trend (source: Dow Jones).
LEAVING TOWN — Between 7/01/19 and 6/30/20, 5 of the 10 largest cities in the U.S. saw their populations decline – New York City, Los Angeles, Chicago, Philadelphia and San Jose (source: Census Bureau, BTN Research).
SPENDING — Americans imported $278 billion of foreign goods and services in March 2021 and $274 billion of imports in April 2021, the 2 highest months in U.S. history (source: Bureau of Econ. Analysis, BTN Research).


Click here to see the full review.

Source: Bloomberg. Asset‐class performance is presented by using market returns from an exchange‐traded fund (ETF) proxy that best represents its respective broad asset class. Returns shown are net of fund fees for and do not necessarily represent performance of specific mutual funds and/or exchange‐traded funds recommended by the Prime Capital Investment Advisors. The performance of those funds may be substantially different than the performance of the broad asset classes and to proxy ETFs represented here. U.S. Bonds (iShares Core U.S. Aggregate Bond ETF); High‐YieldBond(iShares iBoxx $ High Yield Corporate Bond ETF); Intl Bonds (SPDR® Bloomberg Barclays International Corporate Bond ETF); Large Growth (iShares Russell 1000 Growth ETF); Large Value (iShares Russell 1000 ValueETF);MidGrowth(iSharesRussell Mid-CapGrowthETF);MidValue (iSharesRussell Mid‐Cap Value ETF); Small Growth (iShares Russell 2000 Growth ETF); Small Value (iShares Russell 2000 Value ETF); Intl Equity (iShares MSCI EAFE ETF); Emg Markets (iShares MSCI Emerging Markets ETF); and Real Estate (iShares U.S. Real Estate ETF). The return displayed as “Allocation” is a weighted average of the ETF proxies shown as represented by: 30% U.S. Bonds, 5% International Bonds, 5% High Yield Bonds, 10% Large Growth, 10% Large Value, 4% Mid Growth, 4% Mid Value, 2% Small Growth, 2% Small Value, 18% International Stock, 7% Emerging Markets, 3% Real Estate.
Advisory services offered through Prime Capital Investment Advisors, LLC. (“PCIA”), a Registered Investment Adviser. PCIA doing business as Prime Capital Wealth Management (“PCWM”) and Qualified Plan Advisors (“QPA”).

© 2021 Prime Capital Investment Advisors, 6201 College Blvd., 7th Floor, Overland Park, KS 66211.

COVID-19 Week in Review

Month-in-Review: May 2021

Quick Takes

● Heavyweight bout. Much of May was a battle between rising inflation fears and growing optimism from the U.S. economic recovery. Overall, though, the data points to an economy, and corporate earnings picture, that remains in an upswing.
● All’s well that ends well? There were no corrections in May, but trading was choppy. In both the second and third weeks of the month the S&P 500 traded more than ‐4% below the May 7th all‐time high, yet closed May just ‐0.7% off the record. In 11 of May’s 20 trading days, VIX was above 20 but ended at 16.8.
● Everybody’s still a winner. For the second straight month all major asset classes had positive returns, although May’s gains were more modest. Both U.S. and developed international equities are up double digits in 2021, and U.S. real estate is up +18.1%.
● Fixed income was flat. Bonds rose in May, but just barely. The best performers were Treasury‐inflation protected securities (TIPS) and investment‐grade bonds. After a rapid rise in Q1, the 10‐year Treasury yield spent April and May almost entirely in a range between 1.5% and 1.75%, closing May at 1.58%.

Asset Class Performance

May was defined by positive, yet modest, gains for all major asset classes. International developed and emerging market equities led in May. International bonds also finished ahead of U.S. bonds as the U.S. dollar fell further.

Vaccinations & Improving Economy Have Investors Smiling

COVID‐19 trends continue to make material improvements on virtually all fronts. The U.S. has administered over 295 million vaccines, with more than 40% of the population now fully vaccinated. The 7‐day average of new positive cases has declined to the lowest levels since the start of the pandemic and are now down ‐94% from their January highs. The 7‐day average of deaths per day is now under 400, ‐88% from their January highs. The percentage of positive COVID‐19 tests in the U.S. fell below 2% for the first time, a new pandemic low. With all the progress on the vaccination and COVID‐19 case fronts states and businesses began to fully reopen. That has resulted in a U.S. economic recovery unlike any in recent history. Consumers have trillions in extra savings and stimulus funds, banks have amassed capital, business are eager to hire and restock inventories, and new businesses are being established at the fastest pace on record. That all has investors in an optimistic mood. Rather than “Sell in May and Go Away”, investors sent the S&P 500 to new all‐time highs on May 7th while the Cboe VIX volatility index fell to 16.7, near its lowest levels since early 2020. But the remainder of May was a battle between the bulls and bears as the speed of the recovery led to bouts of inflationary scares and shortages of goods, raw materials, and workers. Private sector wages and salaries are up a staggering +19.4%in the past year and are now +5.5% above pre‐COVID levels. Consumer spending was the biggest driver of real GDP growth in Q1, including spending increases for motor vehicles and parts that increased +66.2%, durable goods that rose +48.7%, and food services and accommodations

that jumped +26.6%. Gains like those, even off the extraordinarily low bases from the depths of last year’s COVID lockdowns, are bound to create inflation concerns. U.S. stocks pulled back more than ‐4% from the May 7th all‐time highs in both the second and third weeks of the month, and VIX volatility spiked to about 28 and 26 on each of those declines. But in the end the bulls took the victory as investors pushed aside the inflation fears in favor of recovery optimism. The S&P 500 rose +0.7% to post its fourth consecutive positive month, and sixth of the past seven. The small‐cap Russell 2000 index, which is more leveraged to the economic reopening, posted its eighth straight positive month for the first time since 1995.

Importantly, vaccination rates in Europe have picked up after a relatively slow start. That has helped Eurozone economic sentiment improve for four straight months and hit its highest level since 2018.The COVID crisis in India has also made much needed progress with over 190 million vaccines so far administered–only behind the totals of US and China. As a result, those economies are also rebounding nicely. As seen in the chart above, both developed and emerging international PMIs are rising and are well into expansion levels (above 50). The MSCI EAFE Index gained +3.3% in May, outperforming U.S. stocks for the first time in 2021.

Bottom Line: Global equities rallied for the sixth time in seven months as vaccinations helped accelerate the recovery for most countries. Ongoing fiscal stimulus and improving earnings also boosted investor confidence.

Click here to see the full review.


©2021 Prime Capital Investment Advisors, LLC. The views and information contained herein are (1) for informational purposes only, (2) are not to be taken as a recommendation to buy or sell any investment, and (3) should not be construed or acted upon as individualized investment advice. The information contained herein was obtained from sources we believe to be reliable but is not guaranteed as to its accuracy or completeness. Investing involves risk. Investors should be prepared to bear loss, including total loss of principal. Diversification does not guarantee investment returns and does not eliminate the risk of loss. Past performance is no guarantee of comparable future results.

Source: Bloomberg. Asset‐class performance is presented by using market returns from an exchange‐traded fund (ETF) proxy that best represents its respective broad asset class. Returns shown are net of fund fees for and do not necessarily represent performance of specific mutual funds and/or exchange‐traded funds recommended by the Prime Capital Investment Advisors. The performance of those funds may be substantially different than the performance of the broad asset classes and to proxy ETFs represented here. U.S. Bonds (iShares Core U.S. Aggregate Bond ETF); High‐YieldBond(iShares iBoxx $ High Yield Corporate Bond ETF); Intl Bonds (SPDR® Bloomberg Barclays International Corporate Bond ETF); Large Growth (iShares Russell 1000 Growth ETF); Large Value (iShares Russell 1000 ValueETF);MidGrowth(iSharesRussell Mid‐CapGrowthETF);MidValue (iSharesRussell Mid‐Cap Value ETF); Small Growth (iShares Russell 2000 Growth ETF); Small Value (iShares Russell 2000 Value ETF); Intl Equity (iShares MSCI EAFE ETF); Emg Markets (iShares MSCI Emerging Markets ETF); and Real Estate (iShares U.S. Real Estate ETF). The return displayed as “Allocation” is a weighted average of the ETF proxies shown as represented by: 30% U.S. Bonds, 5% International Bonds, 5% High Yield Bonds, 10% Large Growth, 10% Large Value, 4% Mid Growth, 4%Mid Value, 2% Small Growth, 2% Small Value, 18% International Stock, 7% Emerging Markets, 3% Real Estate.

Advisory services offered through Prime Capital Investment Advisors, LLC. (“PCIA”), a
Registered Investment Adviser. PCIA doing business as Prime Capital Wealth Management
(“PCWM”) and Qualified Plan Advisors (“QPA”).
© 2021 Prime Capital Investment Advisors, 6201 College Blvd., 7th Floor, Overland Park, KS 66211.

Week in Review

Week-in-Review: Week ending in 05.28.21

The Bottom Line

● Stocks rallied during the week to close within 1% of their all‐time high. The S&P 500 gained +1%, but small cap Russell 2000 and tech‐heavy Nasdaq led with gains of
+ 2.4% and +2.1% respectively.
● On Friday, the U.S. Department of Commerce reported that the core personal consumption expenditures price index, the Fed’s favorite inflation measure, surged +3.1%year over year in April, its fastest rise since 1992.
● Despite the higher than expected rise in inflation, bond yields backed off from last week’s levels, with the yield on the U.S. 10‐year Treasury note falling ‐3 basis points to 1.59% after being as low as 1.55% on Monday.

Stocks nearly back to record highs

U.S. stocks rallied during the week as the S&P 500 gained+1.2% to closed just ‐0.7% from its May 7th all‐time high of 4,232. Growth stocks in the Communications Services and Information Technology sectors along with the cyclical sectors of Industrials and Materials led the way. The choppy trading that marked much of May subsided in the final week as the Cboe Volatility Index (VIX) fell to 16.7, down from 20.2 last Friday, and marking its lowest level since April 16. A key inflation indicator, the core personal consumption expenditures price index, rose +3.1% from April of 2020, faster than expectations of +2.9%, and the biggest increase since 1992. Despite the inflation surge, bonds still managed to stay positive for the week. After testing the bottom of its recent trading range at 1.55% on Monday, the yield on the 10‐year U.S. Treasury note ended the week at 1.59%, down 3 basis points from the prior Friday. So called “meme stocks” had a surprise revival during the week, fueled by traders in Reddit’s WallStreetBets forum, with names like AMC Entertainment more than doubling in price. Meanwhile in Washington, President Biden proposed the largest U.S. budget since World War II, with a $6 trillion price tag.

Digits & Did You Knows

HEY BIG SPENDER — 59% of US households made a “large purchase” during the first 4 months of 2021, i.e., January 2021 through and including April 2021, the highest percentage reported in 5 years. “Large purchases” include furniture, home repairs and automobiles (source: Federal Reserve Bank of New York, BTN Research).
ROADTRIP — U.S. drivers are projected to use 9.0 million barrels a day of gasoline during the summer of 2021, up from 7.8 million barrels a day of gasoline used during the 2020 “pandemic‐summer”, but still down from 2019’s 9.6 million barrels a day of gasoline consumed (source: Energy Information Administration, BTN Research).

Click here to see the full review.

Source: Bloomberg. Asset‐class performance is presented by using market returns from an exchange‐traded fund (ETF) proxy that best represents its respective broad asset class. Returns shown are net of fund fees for and do not necessarily represent performance of specific mutual funds and/or exchange‐traded funds recommended by the Prime Capital Investment Advisors. The performance of those funds may be substantially different than the performance of the broad asset classes and to proxy ETFs represented here. U.S. Bonds (iShares Core U.S. Aggregate Bond ETF); High‐YieldBond(iShares iBoxx $ High Yield Corporate Bond ETF); Intl Bonds (SPDR® Bloomberg Barclays International Corporate Bond ETF); Large Growth (iShares Russell 1000 Growth ETF); Large Value (iShares Russell 1000 ValueETF);MidGrowth(iSharesRussell Mid‐CapGrowthETF);MidValue (iSharesRussell Mid‐Cap Value ETF); Small Growth (iShares Russell 2000 Growth ETF); Small Value (iShares Russell 2000 Value ETF); Intl Equity (iShares MSCI EAFE ETF); Emg Markets (iShares MSCI Emerging Markets ETF); and Real Estate (iShares U.S. Real Estate ETF). The return displayed as “Allocation” is a weighted average of the ETF proxies shown as represented by: 30% U.S. Bonds, 5% International Bonds, 5% High Yield Bonds, 10% Large Growth, 10% Large Value, 4% Mid Growth, 4%Mid Value, 2% Small Growth, 2% Small Value, 18% International Stock, 7% Emerging Markets, 3% Real Estate.

Advisory services offered through Prime Capital Investment Advisors, LLC. (“PCIA”), a
Registered Investment Adviser. PCIA doing business as Prime Capital Wealth Management
(“PCWM”) and Qualified Plan Advisors (“QPA”).
© 2021 Prime Capital Investment Advisors, 6201 College Blvd., 7th Floor, Overland Park, KS 66211.

Week in Review

Week-in-Review: Week ending in 05.21.21

The Bottom Line

● Another late week rally was not enough to undo an early week pullback in choppy trading that was reminiscent of last week. In the end the S&P 500 slipped ‐0.4% for its first back‐to‐back weekly decline since February.
● The U.S. 10‐year Treasury yield was flat at 1.62%, down just ‐0.01 percentage points (or 1 basis point) from last week. But the real yield, adjusted for inflation, rose 9 basispointsto ‐0.83% as inflation breakevens eased – the largest weekly rise since February.
● The employment picture improved yet again with weekly jobless claims falling to 444,000, a new pandemic low for the third week in a row and the fourth weekly decline.

Taper talk & crypto crash sink stocks

U.S. stocks finished mixed as fitful trading continued while the S&P 500 attempted to overcome early week losses, but still fell ‐0.4% to post its first back‐to‐back weekly declines since February. But in a counter trend move, the tech‐heavy Nasdaq Composite Index managed to snap a string of four‐straight weekly losses – highlighting the choppiness and cross‐currents that have defined markets the last few weeks. The minutes from the April Federal Open Market Committee meeting showed that some members of the Fed are ready to discuss tapering bond buying at future meetings, though they were clear to say the economy was still far short of its longer‐run goals. The Fed isn’t about to start raising interest rates, but the bond‐buying taper talk opens the door to tightening of monetary policy sooner rather than later. That, plus a wild ride for cryptocurrency investors (in which bitcoin plunged ‐30% at one point on Wednesday), left investors shaken until positive employment and business activity reports helped stabilize markets on Thursday and Friday. On Friday IHS Markit reported that the flash U.S. services and manufacturing Purchasing Managers Index (PMIs) jumped to record highs in May, beating economists’ expectations.

Digits & Did You Knows

PENT‐UP DEMAND — U.S. consumers purchased $234.4 billion of foreign imports in March 2021, the largest monthly total recorded in U.S. history. The low point for the purchase of foreign imports during the pandemic was $166.5 billion in May 2020 (source: BTN Research).
GIVE ME A HUG — As of Friday 5/14/21, 119 million Americans are fully vaccinated, or 36% of our 332 million population (source: CDC, BTN Research).
ROAD TRIP — The average price of a gallon of gasoline reached $3.04 on Friday 5/14/21, up 79 cents a gallon YTD. The last time gasoline closed a calendar year above $3 a gallon was 2013 (source: AAA, BTN Research).

Click here to see the full review.

Source: Bloomberg. Asset‐class performance is presented by using market returns from an exchange‐traded fund (ETF) proxy that best represents its respective broad asset class. Returns shown are net of fund fees for and do not necessarily represent performance of specific mutual funds and/or exchange‐traded funds recommended by the Prime Capital Investment Advisors. The performance of those funds may be substantially different than the performance of the broad asset classes and to proxy ETFs represented here. U.S. Bonds (iShares Core U.S. Aggregate Bond ETF); High‐YieldBond(iShares iBoxx $ High Yield Corporate Bond ETF); Intl Bonds (SPDR® Bloomberg Barclays International Corporate Bond ETF); Large Growth (iShares Russell 1000 Growth ETF); Large Value (iShares Russell 1000 ValueETF);MidGrowth(iSharesRussell Mid‐CapGrowthETF);MidValue (iSharesRussell Mid‐Cap Value ETF); Small Growth (iShares Russell 2000 Growth ETF); Small Value (iShares Russell 2000 Value ETF); Intl Equity (iShares MSCI EAFE ETF); Emg Markets (iShares MSCI Emerging Markets ETF); and Real Estate (iShares U.S. Real Estate ETF). The return displayed as “Allocation” is a weighted average of the ETF proxies shown as represented by: 30% U.S. Bonds, 5% International Bonds, 5% High Yield Bonds, 10% Large Growth, 10% Large Value, 4% Mid Growth, 4%Mid Value, 2% Small Growth, 2% Small Value, 18% International Stock, 7% Emerging Markets, 3% Real Estate.

Advisory services offered through Prime Capital Investment Advisors, LLC. (“PCIA”), a
Registered Investment Adviser. PCIA doing business as Prime Capital Wealth Management
(“PCWM”) and Qualified Plan Advisors (“QPA”).
© 2021 Prime Capital Investment Advisors, 6201 College Blvd., 7th Floor, Overland Park, KS 66211.

Week in Review

Week-in-Review: Week ending in 05.14.21

The Bottom Line

● A big stock rally on Friday couldn’t reverse the losses incurred Monday through Wednesday. The Cboe VIX Volatility Index surged past 28 on Wednesday before falling back under 19 on Friday as the market rebounded.
● Both consumer and producer inflation accelerated much faster than expected and sent stock prices lower and bond yields higher. The S&P 500 fell ‐1.4% and the Nasdaq fell ‐2.4%, while the yield on the benchmark U.S. 10‐year Treasury note rose +0.05% to 1.63%.
● The employment picture continues to improve as weekly jobless claims fell to 473,000, a new pandemic low, and monthly job openings soared to a record 8.123 million.

Inflation fears sparks equity selloff

Global equities were down for the week after inflation accelerated much faster than expected, sparking a broad market selloff that set the S&P 500 back ‐1.4% for the week. For the technology sector, the largest sector in the S&P 500, the downturn was particularly pronounced, as it fell ‐2.2%. The tech‐heavy Nasdaq was down ‐2.1%, its fourth straight weekly decline. The inflation scare came with the April Consumer Price Index (CPI) accelerating at its fastest pace in since 2008, up +4.2% from last year, and the Producer Price Index (PPI) rising +6.2% for the last 12 months, which was the largest increase since the data began in 2010. On Wednesday the S&P 500 and the Nasdaq were down ‐4%and ‐5%, respectively, for the week but a big Friday rally helped limit the week’s damage. The Cboe VIX Volatility Index spiked as high as 28.4 before falling back to 18.8 by the week’s close. The balance of the week’s economic data came in below expectations reversing a weeks‐long trend that saw largely better than expected results. Besides the higher than expected inflation results, retail sales stalled unexpectedly and consumer sentiment was softer than forecasted. On the plus side jobless claims fell more than expected.

Digits & Did You Knows

BE CONTRARIAN — The last 7 times that the S&P 500 index had a negative total return over a trailing 12‐month period, it rebounded each time with a positive total return of at least+15% over the next 12 months. The 1‐year average total return of all 7 comebacks is +27.6%. The last example was when the S&P 500 fell ‐7.0% (total return) for the 12 months ending 3/31/20 but bounced back with a +56.4% total return for the 12 months ending 3/31/21 (source: BTN Research).
NEW HOMES — 103,700 new single‐family homes began construction in the United States in March 2021, the highest monthly total reported nationwide since June 2007 (source: Census Bureau, BTN Research).

Click here to see the full review.

Source: Bloomberg. Asset‐class performance is presented by using market returns from an exchange‐traded fund (ETF) proxy that best represents its respective broad asset class. Returns shown are net of fund fees for and do not necessarily represent performance of specific mutual funds and/or exchange‐traded funds recommended by the Prime Capital Investment Advisors. The performance of those funds may be substantially different than the performance of the broad asset classes and to proxy ETFs represented here. U.S. Bonds (iShares Core U.S. Aggregate Bond ETF); High‐YieldBond(iShares iBoxx $ High Yield Corporate Bond ETF); Intl Bonds (SPDR® Bloomberg Barclays International Corporate Bond ETF); Large Growth (iShares Russell 1000 Growth ETF); Large Value (iShares Russell 1000 ValueETF);MidGrowth(iSharesRussell Mid‐CapGrowthETF);MidValue (iSharesRussell Mid‐Cap Value ETF); Small Growth (iShares Russell 2000 Growth ETF); Small Value (iShares Russell 2000 Value ETF); Intl Equity (iShares MSCI EAFE ETF); Emg Markets (iShares MSCI Emerging Markets ETF); and Real Estate (iShares U.S. Real Estate ETF). The return displayed as “Allocation” is a weighted average of the ETF proxies shown as represented by: 30% U.S. Bonds, 5% International Bonds, 5% High Yield Bonds, 10% Large Growth, 10% Large Value, 4% Mid Growth, 4%Mid Value, 2% Small Growth, 2% Small Value, 18% International Stock, 7% Emerging Markets, 3% Real Estate.

Advisory services offered through Prime Capital Investment Advisors, LLC. (“PCIA”), a
Registered Investment Adviser. PCIA doing business as Prime Capital Wealth Management
(“PCWM”) and Qualified Plan Advisors (“QPA”).
© 2021 Prime Capital Investment Advisors, 6201 College Blvd., 7th Floor, Overland Park, KS 66211.

Week in Review

Week-in-Review: Week ending in 05.07.21

The Bottom Line

● Friday night heights returned as the S&P 500 and Dow closed the week at all‐time highs. The Cboe Volatility Index (VIX) fell from 18.6 last week to end Friday at 16.7.
● The yield on the benchmark U.S. 10‐year Treasury note sank ‐0.05% to 1.58% after a surprisingly big downside miss in jobs created from the April Employment report.
● The headline April jobs number was surprisingly short of the one million new jobs expected with just 266,000 jobs added by U.S. employers during the month. A shortage of workers may be a primary culprit in the jobs shortfall. Average weekly hours worked seems to support that as it matched the highest level since data began in 2006.

TGIF… stocks return to all‐time highs

For the first three weeks that ended in April, the S&P 500 set new all‐time highs. But the end‐of‐the‐week magic ended after that. Last Thursday, 4/29, marked another all‐time high but then stocks slipped back last Friday and haven’t been able to reclaim the record level. But the Friday magic returned on May 7th as the S&P 500 and Dow Jones Industrials jumped back to record levels to end the week. Interestingly it was “bad news is good news” that seemed to have fueled stocks on Friday after the Labor Department released a disappointing April employment report (see the details on the following page). Investors seem to be interpreting the weak data will mean that easy money and accommodative monetary policies will last longer now. Others dismissed the report as an outlier and continued to focus on virtually all other economic data that has been exceptionally strong and better than expected. The weak jobs report sent bond yields lower, with the yield on the 10‐year U.S. falling to 1.58% from 1.63% last Friday. The Cboe Volatility Index (VIX) also tumbled from 18.6 a week ago to 16.7 at the close of this week. The U.S. dollar was decisively lower, and has now given back all of the first quarter’s rally.

Digits & Did You Knows

STICKER SHOCK — Soaring lumber prices add $35,872 to the price of an average new single‐family home. Lumber prices seem to set records daily, now up +67% this year and +340%from last year (source: NAHB, Random Lengths, CNBC).
NEED A SCORECARD — The Biden White House announced its 3rd stimulus proposal since taking office on 1/20/21. The “American Families Plan” is a $1.8 trillion proposal (released on 4/28/21). Previously, the “American Rescue Plan Act,” aka HR #1319, scored at $1.9 trillion and signed into law on 3/11/21 and the “American Jobs Plan,” the $2.3 trillion infrastructure proposal released on 3/31/21, was introduced by the administration (source: White House, BTN Research).

Click here to see the full review.

Source: Bloomberg. Asset‐class performance is presented by using market returns from an exchange‐traded fund (ETF) proxy that best represents its respective broad asset class. Returns shown are net of fund fees for and do not necessarily represent performance of specific mutual funds and/or exchange‐traded funds recommended by the Prime Capital Investment Advisors. The performance of those funds may be substantially different than the performance of the broad asset classes and to proxy ETFs represented here. U.S. Bonds (iShares Core U.S. Aggregate Bond ETF); High‐YieldBond(iShares iBoxx $ High Yield Corporate Bond ETF); Intl Bonds (SPDR® Bloomberg Barclays International Corporate Bond ETF); Large Growth (iShares Russell 1000 Growth ETF); Large Value (iShares Russell 1000 ValueETF);MidGrowth(iSharesRussell Mid‐CapGrowthETF);MidValue (iSharesRussell Mid‐Cap Value ETF); Small Growth (iShares Russell 2000 Growth ETF); Small Value (iShares Russell 2000 Value ETF); Intl Equity (iShares MSCI EAFE ETF); Emg Markets (iShares MSCI Emerging Markets ETF); and Real Estate (iShares U.S. Real Estate ETF). The return displayed as “Allocation” is a weighted average of the ETF proxies shown as represented by: 30% U.S. Bonds, 5% International Bonds, 5% High Yield Bonds, 10% Large Growth, 10% Large Value, 4% Mid Growth, 4%Mid Value, 2% Small Growth, 2% Small Value, 18% International Stock, 7% Emerging Markets, 3% Real Estate.

Advisory services offered through Prime Capital Investment Advisors, LLC. (“PCIA”), a
Registered Investment Adviser. PCIA doing business as Prime Capital Wealth Management
(“PCWM”) and Qualified Plan Advisors (“QPA”).
© 2021 Prime Capital Investment Advisors, 6201 College Blvd., 7th Floor, Overland Park, KS 66211.

Week in Review

Week-in-Review: Week ending in 04.30.21

The Bottom Line

● Global equities were little changed for the week with the S&P 500 essentially flat while the Nasdaq, Russell 2000, and international stocks were slightly negative.
● The yield on the benchmark U.S. 10‐year Treasury note climbed +0.07% to 1.63% as commodity prices continued to rally and inflation expectations continued to rise.
● Transportation stocks are at all‐time highs after 13 straight weeks of gains, their longest winning streak in 122 years. Railroads, airlines and trucking companies make the Dow Jones Transportation Average, which is up + 23% this year as investors reward companies that will benefit from the U.S. returning to normalization.

Americans get back out and about.

Global equities were little change for the week, with the S&P 500 essentially flat at +0.02%, while the Nasdaq Composite and Russell 2000 small cap index fell less than half a percent. Although technology has been the driving force for markets since the pandemic recovery began more than a year ago, it has been old fashioned railroads, airlines, and trucking companies that are enjoying strength lately. The Dow Jones Transportation Average gained +1.4% last week, marking its 13th consecutive weekly advance, which is the index’s longest streak since it rose for 15 straight weeks in January 1899. The Transportation index is up +23% this year, to all‐time highs, and well ahead of the +10‐15% gains other U.S. indices are up. The Transportation’s strength underscores investors’ high expectations for a rebounding economy that will benefit companies carrying goods and raw materials as Americans get back out and spend again. And spend they did. The U.S. reported a +6.4% first quarter GDP growth fueled by a surge in personal consumption, to a +10.7%annual rate, the second best rate of spending since the 1960s. Corporate earning have maintained their impressive growth, now running at +45.7% with about 60% reported.

Digits & Did You Knows

RENT IS DUE —The median asking monthly rent rose to$1,463 in March across the country’s 50 largest markets, according to a report from Realtor.com. That’s a +1.1%increase on an annual basis and the first month where the pace of rent growth increased since last summer, the report showed. The Covid‐19 vaccine rollout and rising employment are prompting more people to move back into cities and look for apartments to rent (source: Realtor.com, WSJ).
STICKER SHOCK — The median sales price of existing homes sold in the U.S. was $329,100 in March 2021, an all‐time high both on a nominal basis and on an inflation‐adjusted basis (source: National Association of Realtors, BTN Research).

Click here to see the full review.

Source: Bloomberg. Asset‐class performance is presented by using market returns from an exchange‐traded fund (ETF) proxy that best represents its respective broad asset class. Returns shown are net of fund fees for and do not necessarily represent performance of specific mutual funds and/or exchange‐traded funds recommended by the Prime Capital Investment Advisors. The performance of those funds may be substantially different than the performance of the broad asset classes and to proxy ETFs represented here. U.S. Bonds (iShares Core U.S. Aggregate Bond ETF); High‐YieldBond(iShares iBoxx $ High Yield Corporate Bond ETF); Intl Bonds (SPDR® Bloomberg Barclays International Corporate Bond ETF); Large Growth (iShares Russell 1000 Growth ETF); Large Value (iShares Russell 1000 ValueETF);MidGrowth(iSharesRussell Mid‐CapGrowthETF);MidValue (iSharesRussell Mid‐Cap Value ETF); Small Growth (iShares Russell 2000 Growth ETF); Small Value (iShares Russell 2000 Value ETF); Intl Equity (iShares MSCI EAFE ETF); Emg Markets (iShares MSCI Emerging Markets ETF); and Real Estate (iShares U.S. Real Estate ETF). The return displayed as “Allocation” is a weighted average of the ETF proxies shown as represented by: 30% U.S. Bonds, 5% International Bonds, 5% High Yield Bonds, 10% Large Growth, 10% Large Value, 4% Mid Growth, 4%Mid Value, 2% Small Growth, 2% Small Value, 18% International Stock, 7% Emerging Markets, 3% Real Estate.

Advisory services offered through Prime Capital Investment Advisors, LLC. (“PCIA”), a
Registered Investment Adviser. PCIA doing business as Prime Capital Wealth Management
(“PCWM”) and Qualified Plan Advisors (“QPA”).
© 2021 Prime Capital Investment Advisors, 6201 College Blvd., 7th Floor, Overland Park, KS 66211.

Week in Review

Week-in-Review: Week ending in 04.23.21

The Bottom Line

● The S&P 500 Index was just 0.13% away from making its fourth consecutive weekly record high. Trading was choppy during the week despite strong economic data and stellar earning results with more S&P 500 companies beating EPS estimates than average, and beating those EPS estimates by a wider margin than average.
● After rising for essentially every week in February and March, the yield on the 10‐year U.S. Treasury bond has fallen for each of the three full weeks in April, going from a closing high of 1.722 on 4/2 to 1.558 on Friday 4/23. That has helped the Bloomberg Barclays US Aggregate Bond Index to gains in three of the last four weeks.

Missed it by that much…

U.S. stocks just missed making record highs for the fourth Friday in a row following a week of choppy trading. The S&P 500 rallied more than +1% on Friday after a sharp drop on Thursday on news that the Biden administration planned to nearly double capital gains taxes on high income earners. The rebound on Friday was buoyed by new highs in both the services and manufacturing Markit Purchasing Managers Indexes (PMIs) suggesting faster and broader growth in the second quarter than was already expected. The PMI data underscored strong economic activity data from the Chicago and Kansas City Fed regional economic surveys. New home sales were also very strong, as was the Conference Board’s Leading Economic Index (LEI). Meanwhile, it is shaping up to be a stellar earnings season, particularly for cyclical sectors like banks and retailers. According to The Earnings Scout the new blended first quarter earnings growth estimate for the S&P 500 is +24.2% from last year. At the beginning of the year, Wall Street was only expecting +12.2% growth for the first quarter. FactSet reports that 84% of S&P 500 companies have beaten estimates so far, which would tie the highest earnings beat rate since FactSet began the data in 2008.

Digits & Did You Knows

GROWING DEMAND, LAGGING SUPPLY —Inflation, as measured by the Consumer Price Index (CPI), was up +0.62%in March 2021, the highest monthly rate recorded in the United States since June 2009 (almost 12 years ago). There have been just 6 months in the last 30 years (360 months) when monthly U.S. inflation has been greater than +0.62%(source: Bureau of Labor Statistics, BTN Research).
DO YOU HAVE ANY PEANUTS? — 1.49 million travelers went through TSA screening at U.S. airports last Thursday 4/15/21, up from just 95,085 screened passengers on 4/15/20, but still down from 2.62 million passengers on 4/15/19 (source: Transportation Security Administration, BTN Research).

Click here to see the full review.

Source: Bloomberg. Asset‐class performance is presented by using market returns from an exchange‐traded fund (ETF) proxy that best represents its respective broad asset class. Returns shown are net of fund fees for and do not necessarily represent performance of specific mutual funds and/or exchange‐traded funds recommended by the Prime Capital Investment Advisors. The performance of those funds may be substantially different than the performance of the broad asset classes and to proxy ETFs represented here. U.S. Bonds (iShares Core U.S. Aggregate Bond ETF); High‐YieldBond(iShares iBoxx $ High Yield Corporate Bond ETF); Intl Bonds (SPDR® Bloomberg Barclays International Corporate Bond ETF); Large Growth (iShares Russell 1000 Growth ETF); Large Value (iShares Russell 1000 ValueETF);MidGrowth(iSharesRussell Mid‐CapGrowthETF);MidValue (iSharesRussell Mid‐Cap Value ETF); Small Growth (iShares Russell 2000 Growth ETF); Small Value (iShares Russell 2000 Value ETF); Intl Equity (iShares MSCI EAFE ETF); Emg Markets (iShares MSCI Emerging Markets ETF); and Real Estate (iShares U.S. Real Estate ETF). The return displayed as “Allocation” is a weighted average of the ETF proxies shown as represented by: 30% U.S. Bonds, 5% International Bonds, 5% High Yield Bonds, 10% Large Growth, 10% Large Value, 4% Mid Growth, 4%Mid Value, 2% Small Growth, 2% Small Value, 18% International Stock, 7% Emerging Markets, 3% Real Estate.

Advisory services offered through Prime Capital Investment Advisors, LLC. (“PCIA”), a
Registered Investment Adviser. PCIA doing business as Prime Capital Wealth Management
(“PCWM”) and Qualified Plan Advisors (“QPA”).
© 2021 Prime Capital Investment Advisors, 6201 College Blvd., 7th Floor, Overland Park, KS 66211.


Posts navigation