The buzz word of the year in the financial industry has without a doubt been “transitory.” This is the label that Federal Reserve Chairman, Jerome Powell, Treasury Secretary, Janet Yellen, and many leading economists have placed upon the recent surge in inflationary pressure sweeping across the country. While inflation has been somewhat dormant coming out of the financial crisis in ’08-’09, it’s been painfully visible for anyone who has tried to build a deck, buy a used car, or hire new employees in recent months. Inflation can also have major implications for financial markets, as analysts and investors obsess over every word from the Federal Reserve trying to understand exactly when this unprecedented level of “easy” monetary policy will start winding down.
The argument from those in the “transitory” camp would suggest that this bump in prices was inevitable due to the massive disruption in the supply chain from the COVID-related shutdowns, coupled with a surge in demand from consumers as the economy springs back to life. The Federal Reserve sagely began preparing for this scenario almost a year ago, when they shifted their “inflation control” policy to seek an average rate of 2% over the long run, rather than a fixed target, giving themselves the flexibility to keep policy loose (interest rates low) even if inflations should spike for a few months or even a few years.
Those that fear runaway inflation would argue that this new approach could be dangerous. They are concerned that the massive amount of stimulus money sent directly to consumers in the last 12 months, funded by an ever-increasing mountain of debt, will cause prices to spin out of control. The consequence of this, they fear, would be a need for a more drastic movement upward in interest rates, as was seen in the 1980’s. This could indeed cause a severe recession and potentially a sharp decline in real estate prices as affordability would drop overnight.
So which side is correct? We will take a deeper dive into this topic in our quarterly newsletter, but in short, we fall somewhere in the middle. We’ve already seen evidence of cooling in some of the hottest commodities from a few months ago (lumber, copper, etc.). But it’s quite possible that other areas that have seen price increases, such as the cost of labor, might be more sustained. This “elevated” but not “runaway” level of inflation shouldn’t spell disaster for investors, but does require careful consideration in the portfolio construction process. As I mentioned above, stay tuned for more on this topic in the coming weeks, but please don’t hesitate to reach out to our team if you would like to discuss your personal thoughts and concerns in more detail.


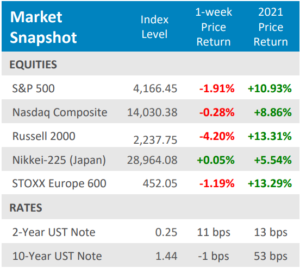


 that jumped +26.6%. Gains like those, even off the extraordinarily low bases from the depths of last year’s COVID lockdowns, are bound to create inflation concerns. U.S. stocks pulled back more than ‐4% from the May 7th all‐time highs in both the second and third weeks of the month, and VIX volatility spiked to about 28 and 26 on each of those declines. But in the end the bulls took the victory as investors pushed aside the inflation fears in favor of recovery optimism. The S&P 500 rose +0.7% to post its fourth consecutive positive month, and sixth of the past seven. The small‐cap Russell 2000 index, which is more leveraged to the economic reopening, posted its eighth straight positive month for the first time since 1995.
 Importantly, vaccination rates in Europe have picked up after a relatively slow start. That has helped Eurozone economic sentiment improve for four straight months and hit its highest level since 2018.The COVID crisis in India has also made much needed progress with over 190 million vaccines so far administered–only behind the totals of US and China. As a result, those economies are also rebounding nicely. As seen in the chart above, both developed and emerging international PMIs are rising and are well into expansion levels (above 50). The MSCI EAFE Index gained +3.3% in May, outperforming U.S. stocks for the first time in 2021.