
Quick Takes
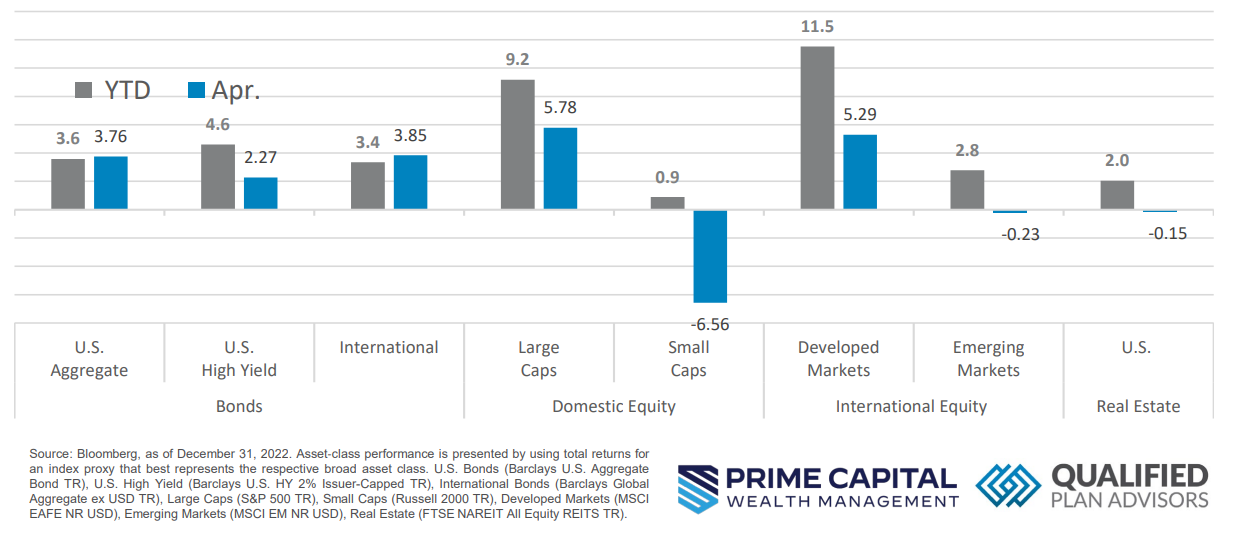
- Risk Assets Mostly In the Green. Risk assets had a bumpy ride for the month of April but finished largely positive. Small Caps were the exception to that, dropping -6.56% for the month, but clinging to a slightly positive year-to-date gain.
- Mixed Inflation Data. Several inflation metrics, like CPI, showed some signs of cooling at the headline reading but some of the underlying data suggests that prices are remaining stubbornly high in key areas. Core PCE, the Fed’s preferred metric, came in above expectations for the month.
- Dollar Takes a Rollercoaster Ride. The dollar had a bumpy month, posting lower highs before bottoming out about halfway through the month. From there, it recovered during the second half of the month but ultimately finished lower for April.
- Labor Markets and Economic Production. Unemployment ticked down to 3.5%, missing expectations of 3.6%, but the JOLTS came in below expectations for the month of February. Disappointing to the downside, initial GDP numbers came in well below expectations, which reignited recession fears amongst market participants.
Asset Class Performance
It wasn’t a smooth ride for the month of April, but most risk assets finished in the green for the month of April. Small Cap equities, Emerging Markets, and Real Estate were the exception to this. With stress in the banking system still reverberating, market participants will be eagerly awaiting the FOMC Rate Decision in early May.
Markets & Macroeconomics
Initial estimates for first quarter economic production, as measured by Gross Domestic Product (“GDP”), missed estimates of +1.9%, landing at +1.1%. Digging into some of the underlying inputs in the GDP calculation, corporations have substantially cut investment in both projects as well as inventories. This should come as no surprise to market participants as this was the desired outcome from the Fed rapidly increasing interest rates. With business investment showing material signs of decline, eventually this should alleviate some of the pressure on prices, i.e., inflation. Looking at businesses in isolation, everything appears to be going according to the Fed’s plan, but when zoomed out, it appears that consumers have curbed spending as businesses have. In the lower chart above, it’s illustrated that consumers increased their spending in the first quarter of the year. While the metric came in slightly below estimates of +4.0%, at 3.7%, increases were across the board in both goods and services, including a bump up in motor vehicle spending. With interest rates retreating from their recent highs due to volatility in the banking sector, it’s possible that consumers jumped at the opportunity of relatively cheaper financing. With consumer spending maintaining a level of resiliency, it’s of little surprise that the Fed’s preferred inflation metric, Core PCE Deflator, came in hotter than expected at +4.9% versus +4.7% for the first quarter of the year. Hotter than expected inflation data would all but lead market participants to anticipate an increase in interest rates at the May FOMC meeting, but the full impact of the stress in the banking sector likely hasn’t made it full cycle just yet, so this could lead to the FOMC to pause their monetary tightening to focus on stability. At the end of April, the market was pricing in a 25bp increase in interest rates in May and then assumed that the Fed will pause their hiking cycle. Market participants will likely be eagerly awaiting the FOMC’s decision but will have plenty to chew on with earnings season fully underway.
Bottom Line: The economy showed more signs of slowing down with GDP coming in softer than expected. Despite this slowdown in economic production, Consumer Spending remained resilient for the first quarter of the year, which ultimately led to the Fed’s preferred inflation metric, Core PCE, coming in hotter than expected. While the full impact of the stress within the banking sector is still working its way through the system, the market was pricing in a 25bp increase in interest rates at the May FOMC meeting and then assumes that the Fed will pause their interest rate hiking cycle.
Download the full review.
©2023 Prime Capital Investment Advisors, LLC. The views and information contained herein are (1) for informational purposes only, (2) are not to be taken as a recommendation to buy or sell any investment, and (3) should not be construed or acted upon as individualized investment advice. The information contained herein was obtained from sources we believe to be reliable but is not guaranteed as to its accuracy or completeness. Investing involves risk. Investors should be prepared to bear loss, including total loss of principal. Diversification does not guarantee investment returns and does not eliminate the risk of loss. Past performance is no guarantee of comparable future results.
Source: Bloomberg. Asset‐class performance is presented by using market returns from an exchange‐traded fund (ETF) proxy that best represents its respective broad asset class. Returns shown are net of fund fees for and do not necessarily represent performance of specific mutual funds and/or exchange-traded funds recommended by the Prime Capital Investment Advisors. The performance of those funds June be substantially different than the performance of the broad asset classes and to proxy ETFs represented here. U.S. Bonds (iShares Core U.S. Aggregate Bond ETF); High‐Yield Bond (iShares iBoxx $ High Yield Corporate Bond ETF); Intl Bonds (SPDR® Bloomberg Barclays International Corporate Bond ETF); Large Growth (iShares Russell 1000 Growth ETF); Large Value (iShares Russell 1000 Value ETF); Mid Growth (iShares Russell Mid-Cap Growth ETF); Mid Value (iShares Russell Mid-Cap Value ETF); Small Growth (iShares Russell 2000 Growth ETF); Small Value (iShares Russell 2000 Value ETF); Intl Equity (iShares MSCI EAFE ETF); Emg Markets (iShares MSCI Emerging Markets ETF); and Real Estate (iShares U.S. Real Estate ETF). The return displayed as “Allocation” is a weighted average of the ETF proxies shown as represented by: 30% U.S. Bonds, 5% International Bonds, 5% High Yield Bonds, 10% Large Growth, 10% Large Value, 4% Mid Growth, 4% Mid Value, 2% Small Growth, 2% Small Value, 18% International Stock, 7% Emerging Markets, 3% Real Estate.
Advisory products and services offered by Investment Adviser Representatives through Prime Capital Investment Advisors, LLC (“PCIA”), a federally registered investment adviser. PCIA: 6201 College Blvd., Suite#150, Overland Park, KS 66211. PCIA doing business as Prime Capital Wealth Management (“PCWM”) and Qualified Plan Advisors (“QPA”). Securities offered by Registered Representatives through Private Client Services, Member FINRA/SIPC. PCIA and Private Client Services are separate entities and are not affiliated.
© 2023 Prime Capital Investment Advisors, 6201 College Blvd., Suite #150, Overland Park, KS 66211.
- Alphabet stock pullback a buying opportunity - July 25, 2024
- Prime Capital Investment Advisors Welcomes James Burton as Independent Director of Advisory Board - July 15, 2024
- How Tax Planning Differs For Young Clients - July 15, 2024