
Quick Takes
- Another Rough Month For Risk Assets. Risk assets resumed their downward trend after last month’s brief break. Stocks, as measured by the S&P 500 index, closed out the month down -8.25%, leading to the worst first six months of a year in 52 years.
- Consumers Are Not Excited About The Future. With the Fed attempting to reign in overheating inflation via increasing interest rates, consumers begin to feel the pressure of the tightening financial conditions. The University of Michigan’s Consumer Sentiment Survey reached its lowest level in history.
- Greenback Resumes Grind Higher. The dollar spent the first half of the month climbing upward, before retreating from its high point in the month on the 15th and spent the remainder of the month trading mostly sideways.
- Production, Labor Markets, and Inflation. While labor markets are still showing healthy signs, the Bureau of Labor Statistics reported that at current unemployment levels, there are almost two jobs for every out of work laborer, signs that the Fed’s tightening of financial conditions are possibly starting to moderate demand, which may begin to bleed over into labor markets.
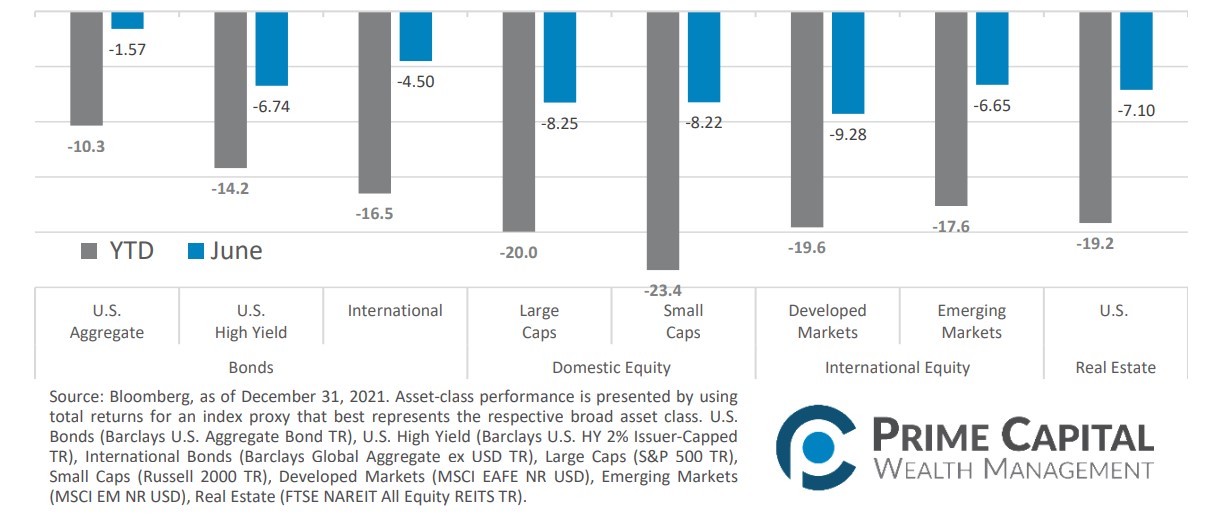
Asset Class Performance
Sellers returned to the market after taking a brief pause in May. Risk Assets were negative for the month across the board and across the globe. International Developed markets had the biggest drawdown for June, with US Small Cap stocks following closely behind. Bonds offered some downside protection for the month, but were still in the red.
Markets & Macroeconomics
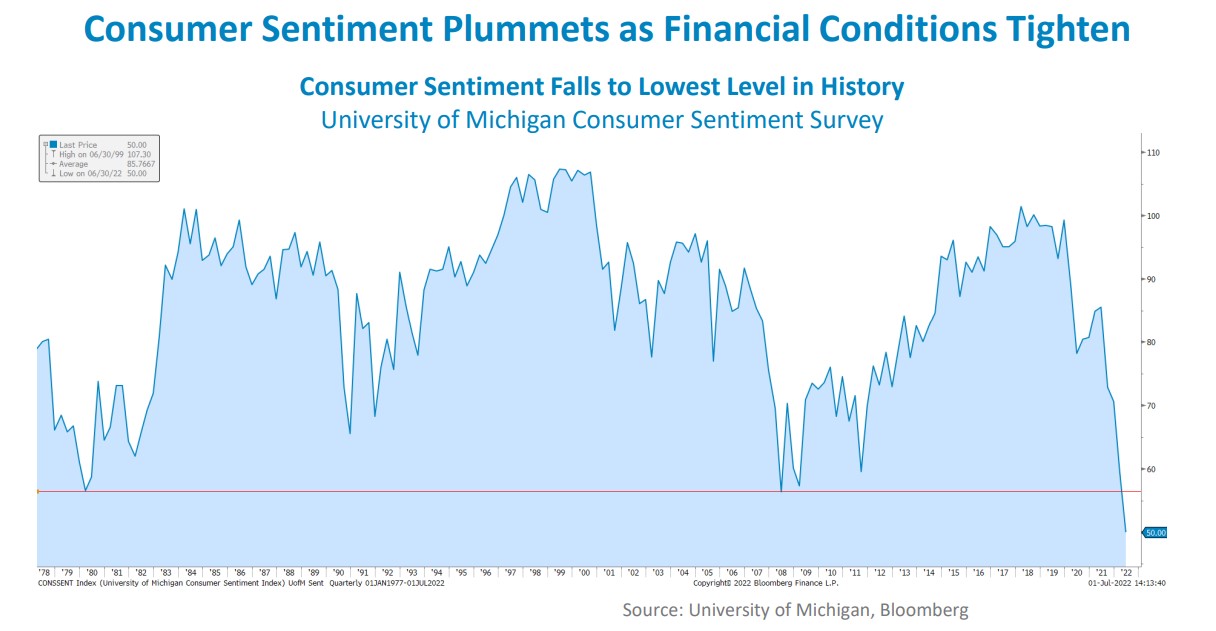
After the Fed enacted a supersized 75bps interest rate hike during their June meeting, Consumer Sentiment, as measured by the University of Michigan Consumer Sentiment Survey, fell to its lowest level in history. The previous record low occurred during the Great Financial Crisis of 2008 when the financial system was wrought with systemic issues, which was only slightly lower than the 1980s when inflation, as measured by the Consumer Price Index, was running close to 15% on an annualized basis. The FOMC made this decision on the heels of an inflation reading, as measured by the Consumer Price Index, which came in well above expectations of +8.3% at +8.6% for the month of May on an annualized basis. Throughout the month, FOMC members’ rhetoric continued to promise that taming runaway inflation was their top priority. Chairman Powell gave guidance during his press conference that they do not anticipate rate hikes of this magnitude in future hikes but left some wiggle room by saying that a 75bps hike for the next meeting in July is not off the table. With the Fed increasing their pace of the tightening of financial conditions, the effects of this policy regime are reverberating across the economy. As mentioned above, consumers are feeling the pressure of this tightening as evidenced by Consumer Sentiment falling to its lowest level in history, additionally, GDP for the first quarter of the year came in below expectations of -1.5%, landing at -1.6% on an annualized basis. With this being the second reading in a row of contraction in economic production, as measured by change in GDP, the U.S. economy is in what is called a technical recession. While concerning, GDP readings are often volatile due to the inexact science that goes into the calculation methodologies, which often leads to market participants taking these readings with a grain of salt. Regardless, it seems that the strong labor market is the one area of the US economy that continues to boom, cushioning the impact of the contraction in economic production.
Bottom Line: The Fed continued to tighten monetary policy and upped their game in June by enacting a 75bps hike in interest rates. The effects of this tightening are hitting consumers hard with Consumer Sentiment falling to its lowest levels in history. Consumers aren’t the only ones feeling the pressure, as this tightening has led to a contraction in GDP numbers for the second quarter in a row, landing the US economy in a technical recession. Despite this, the labor market remains strong and may prop up the economy.
Download the full review.
©2022 Prime Capital Investment Advisors, LLC. The views and information contained herein are (1) for informational purposes only, (2) are not to be taken as a recommendation to buy or sell any investment, and (3) should not be construed or acted upon as individualized investment advice. The information contained herein was obtained from sources we believe to be reliable but is not guaranteed as to its accuracy or completeness. Investing involves risk. Investors should be prepared to bear loss, including total loss of principal. Diversification does not guarantee investment returns and does not eliminate the risk of loss. Past performance is no guarantee of comparable future results.
Source: Bloomberg. Asset‐class performance is presented by using market returns from an exchange‐traded fund (ETF) proxy that best represents its respective broad asset class. Returns shown are net of fund fees for and do not necessarily represent performance of specific mutual funds and/or exchange-traded funds recommended by the Prime Capital Investment Advisors. The performance of those funds June be substantially different than the performance of the broad asset classes and to proxy ETFs represented here. U.S. Bonds (iShares Core U.S. Aggregate Bond ETF); High‐Yield Bond (iShares iBoxx $ High Yield Corporate Bond ETF); Intl Bonds (SPDR® Bloomberg Barclays International Corporate Bond ETF); Large Growth (iShares Russell 1000 Growth ETF); Large Value (iShares Russell 1000 Value ETF); Mid Growth (iShares Russell Mid-Cap Growth ETF); Mid Value (iShares Russell Mid-Cap Value ETF); Small Growth (iShares Russell 2000 Growth ETF); Small Value (iShares Russell 2000 Value ETF); Intl Equity (iShares MSCI EAFE ETF); Emg Markets (iShares MSCI Emerging Markets ETF); and Real Estate (iShares U.S. Real Estate ETF). The return displayed as “Allocation” is a weighted average of the ETF proxies shown as represented by: 30% U.S. Bonds, 5% International Bonds, 5% High Yield Bonds, 10% Large Growth, 10% Large Value, 4% Mid Growth, 4% Mid Value, 2% Small Growth, 2% Small Value, 18% International Stock, 7% Emerging Markets, 3% Real Estate.
Advisory services offered through Prime Capital Investment Advisors, LLC. (“PCIA”), a Registered Investment Adviser. PCIA doing business as Prime Capital Wealth Management (“PCWM”) and Qualified Plan Advisors (“QPA”).
© 2022 Prime Capital Investment Advisors, 6201 College Blvd., Suite #150, Overland Park, KS 66211.
- Alphabet stock pullback a buying opportunity - July 25, 2024
- Prime Capital Investment Advisors Welcomes James Burton as Independent Director of Advisory Board - July 15, 2024
- How Tax Planning Differs For Young Clients - July 15, 2024