The Bottom Line
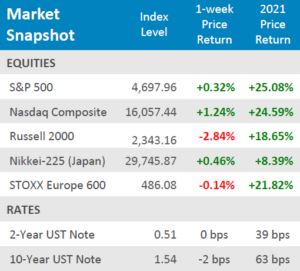
● Domestic equities posted mixed results for the week after global case counts of the delta variant shot up, which dragged European equities off their recent record highs.
● Yields were muted for the week, the 2-year treasury yield was flat, and the 10-year yield rose +2bps.
● Economic data releases for the week were mostly manufacturing related, and broadly came in above expectations, overall industrial production easily exceeded consensus estimates. Retail sales for last month also came in above expectations, but jobless claims exceeded estimates for the second week in a row and the import price index was hotter than expected.
Global Delta Variant Cases Increase
Delta variant cases across the globe showed signs of increasing at a rate not seen since the start of the global pandemic, especially overseas in European countries. The jump in cases caused market participants to hesitate with the fears of government mandated lockdowns returning to the dismay of traders and consumers alike. After hitting a fresh high in the middle of the week, European equities, as measured by the STOXX Europe 600, retraced slightly and ultimately finished the week in the red, down -0.14%. Japanese equities faired much better with the Nikkei-225 up + 0.46% for the week. Domestic equities started the week off strong after retail sales surprised to the upside but gave up some ground in the middle of the week, the S&P 500 was able to cling to its weekly gain and ended modestly up + 0.32%. The rise in fears that economies may return to lock downs spurred a revival in the tech heavy Nasdaq index, up+1.24% for the week. Small Cap equities weren’t as fortunate with the Russell 2000 index falling -2.84% for the week. With the holiday season fast approaching, market participants will be closely watching case counts and the probability of government mandated restrictions in the coming weeks.
Digits & Did You Knows
INFLATION – Wages and benefits for all civilian workers in the US increased by +1.3% in the third quarter of 2021, the largest quarter-over-quarter change since the first quarter of 2003.
(source: Bureau of Labor Statistics, BTN Research).
MOVING THERE – Of the 50 largest American cities per the 2020 Census, Fort Worth, TX. Experiences the largest percentage growth rate, +24%, over the last decade, while Detroit suffered the largest percentage loss, down -10.5%. Just four of the top 50 US cities lost population in the last decade. (source: Census Bureau, BTN Research).
THE TOP DOG – The highest paid college football coach in 2006 was Bob Stoops of Oklahoma, making $3m a year. The highest paid coach in 2021 is Nick Saban of Alabama, making $9.75m this year. (source: USA Today, BTN Research).
Click here to see the full review.
—
Source: Bloomberg. Asset‐class performance is presented by using market returns from an exchange‐traded fund (ETF) proxy that best represents its respective broad asset class. Returns shown are net of fund fees for and do not necessarily represent performance of specific mutual funds and/or exchange‐traded funds recommended by the Prime Capital Investment Advisors. The performance of those funds may be substantially different than the performance of the broad asset classes and to proxy ETFs represented here. U.S. Bonds (iShares Core U.S. Aggregate Bond ETF); High‐YieldBond(iShares iBoxx $ High Yield Corporate Bond ETF); Intl Bonds (SPDR® Bloomberg Barclays International Corporate Bond ETF); Large Growth (iShares Russell 1000 Growth ETF); Large Value (iShares Russell 1000 ValueETF);MidGrowth(iSharesRussell Mid‐CapGrowthETF);MidValue (iSharesRussell Mid‐Cap Value ETF); Small Growth (iShares Russell 2000 Growth ETF); Small Value (iShares Russell 2000 Value ETF); Intl Equity (iShares MSCI EAFE ETF); Emg Markets (iShares MSCI Emerging Markets ETF); and Real Estate (iShares U.S. Real Estate ETF). The return displayed as “Allocation” is a weighted average of the ETF proxies shown as represented by: 30% U.S. Bonds, 5% International Bonds, 5% High Yield Bonds, 10% Large Growth, 10% Large Value, 4% Mid Growth, 4%Mid Value, 2% Small Growth, 2% Small Value, 18% International Stock, 7% Emerging Markets, 3% Real Estate.
Advisory services offered through Prime Capital Investment Advisors, LLC. (“PCIA”), a Registered Investment Adviser. PCIA doing business as Prime Capital Wealth Management (“PCWM”) and Qualified Plan Advisors (“QPA”).
© 2021 Prime Capital Investment Advisors, 6201 College Blvd., Suite #150, Overland Park, KS 66211.
- Month-in-Review: April 2022 - May 5, 2022
- Month-in-Review: March 2022 - April 5, 2022
- Week-in-Review: Week ending in 03.25.22 - March 28, 2022


