The Bottom Line
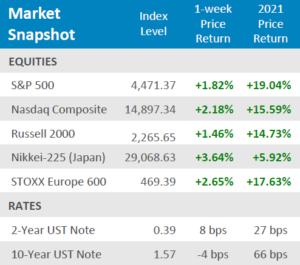
● Equities posted a strong week as earning announcements began to roll in. International equities outperformed U.S. equities, but all major indices were in the green.
● The 10-Year yield fell for the week, down -4bps, but the 2- Year yield jumped up for the week, up +8bps.
● Economic news hinted to some signs of improvement with inflation metrics still showing an increase, but at a slower than expected pace and employment data showed some early signs of strength with jobless claims falling to its lowest level since March of 2020. Sentiment and Optimism remain depressed, however.
Earnings Kickstarts Equities
As the early reporters for Q3 began announcing their earnings this week, equity markets rose with the solid results thus far. Primarily, the announcements have been centered around mega-sized banks, which have reported robust results from M&A dealmaking activity. The S&P 500 rose+1.82% for the week, but the Nasdaq had an even better week, up +2.18% for the week. Small Cap equities weren’t left behind either, with the Russell 2000 posting a solid gain, up +1.46% for the week. International equities were the winners though with Japanese equities outperforming other major indices, the Nikkei-225 was up +3.64% for the week. European equities also outperformed U.S. equities, the STOXX Europe 600 was up +2.65% for the week. Inflation concerns still seem to be top of mind for consumers with sentiment falling and small businesses seem equally hesitant with optimism coming in lighter than expected. Small businesses are still having difficulties finding workers and supply chain hiccups are still adding pressure to prices, but at a slower pace than seen earlier. Producers seem to be passing increased input costs to consumers, but this has been adding to inflationary pressures. Despite increased costs, consumers are still spending as evidenced by the surprise in retail sales.
Digits & Did You Knows
IMPACTS MANY PRODUCTS – Oil prices have gone up +64% YTD, i.e., West Texas Intermediate crude has gone from $48.52 a barrel as of 12/31/2020 to $79.35 a barrel as of 10/08/2021. (source: NYMEX, BTN Research).
WEALTHIEST FAMILIES – The top 5% of US households own 71% of US equities, while the top 20% of US households own 93% of US equities . (source: Survey of Consumer Finances, Federal Reserve Board, BTN Research).
SAME FOR YOU? – The total household net worth in America is up +47% in the last 4 years and is up +89% in the last 8 years. The total US household net worth was $74.8 trillion as of
06/30/13, was $96.2 trillion as of 6/30/17, and was $141.7 trillion as of 06/30/21. (source: Federal Reserve, BTN Research).
Click here to see the full review.
—
Source: Bloomberg. Asset‐class performance is presented by using market returns from an exchange‐traded fund (ETF) proxy that best represents its respective broad asset class. Returns shown are net of fund fees for and do not necessarily represent performance of specific mutual funds and/or exchange‐traded funds recommended by the Prime Capital Investment Advisors. The performance of those funds may be substantially different than the performance of the broad asset classes and to proxy ETFs represented here. U.S. Bonds (iShares Core U.S. Aggregate Bond ETF); High‐YieldBond(iShares iBoxx $ High Yield Corporate Bond ETF); Intl Bonds (SPDR® Bloomberg Barclays International Corporate Bond ETF); Large Growth (iShares Russell 1000 Growth ETF); Large Value (iShares Russell 1000 ValueETF);MidGrowth(iSharesRussell Mid‐CapGrowthETF);MidValue (iSharesRussell Mid‐Cap Value ETF); Small Growth (iShares Russell 2000 Growth ETF); Small Value (iShares Russell 2000 Value ETF); Intl Equity (iShares MSCI EAFE ETF); Emg Markets (iShares MSCI Emerging Markets ETF); and Real Estate (iShares U.S. Real Estate ETF). The return displayed as “Allocation” is a weighted average of the ETF proxies shown as represented by: 30% U.S. Bonds, 5% International Bonds, 5% High Yield Bonds, 10% Large Growth, 10% Large Value, 4% Mid Growth, 4%Mid Value, 2% Small Growth, 2% Small Value, 18% International Stock, 7% Emerging Markets, 3% Real Estate.
Advisory services offered through Prime Capital Investment Advisors, LLC. (“PCIA”), a Registered Investment Adviser. PCIA doing business as Prime Capital Wealth Management (“PCWM”) and Qualified Plan Advisors (“QPA”).
© 2021 Prime Capital Investment Advisors, 6201 College Blvd., 7th Floor, Overland Park, KS 66211.
- Month-in-Review: April 2022 - May 5, 2022
- Month-in-Review: March 2022 - April 5, 2022
- Week-in-Review: Week ending in 03.25.22 - March 28, 2022


